 Search
Trading BO with the indicators on your Android device
Page 1 of 4 • 1, 2, 3, 4 ![]()

Trading BO with the indicators on your Android device
![]() oficial-Ayrex Tue Mar 28, 2017 6:07 pm
oficial-Ayrex Tue Mar 28, 2017 6:07 pm
oficial-Ayrex- Posts : 253
Join date : 2017-01-13
Re: Trading BO with the indicators on your Android device
![]() oficial-Ayrex Tue Mar 28, 2017 6:10 pm
oficial-Ayrex Tue Mar 28, 2017 6:10 pm

oficial-Ayrex- Posts : 253
Join date : 2017-01-13
Re: Trading BO with the indicators on your Android device
![]() oficial-Ayrex Tue Mar 28, 2017 6:12 pm
oficial-Ayrex Tue Mar 28, 2017 6:12 pm
- Make all your mistakes early in life. The more tough lessons early on, the fewer errors you make later.
- Always make your living doing something you enjoy.
- Be intellectually competitive. The key to research is to assimilate as much data as possible in order to be to the first to sense a major change.
- Make good decisions even with incomplete information. You will never have all the information you need. What matters is what you do with the information you have.
- Always trust your intuition, which resembles a hidden supercomputer in the mind. It can help you do the right thing at the right time if you give it a chance.
- Don't make small investments. If you're going to put money at risk, make sure the reward is high enough to justify the time and effort you put into the investment decision.

Investing rules can be different for every trader. You can set your own with Ayrex right now!
oficial-Ayrex- Posts : 253
Join date : 2017-01-13
Pairs trading and how to work with it
![]() oficial-Ayrex Tue Mar 28, 2017 6:14 pm
oficial-Ayrex Tue Mar 28, 2017 6:14 pm
Being created back in 1980s by the small group of computer scientists, mathematicians and physicists, pairs trading strategy focuses on determining 2 currency pairs with strong historical correlation. Keeping it short, pairs trader monitors performance of both pairs and when one asset starts to move up and another one falls simultaneously, shorts the outperforming asset and longs the underperforming one. In such case, the main profit consists of the spread between them.
Pairs trading brought more than $50 millions to its creators only in the first years and can be considered as one of the most profitable strategies, if you posses the right skills for it. To become successful pairs trader, pay special attention to your position sizing, market timing and decision making skills.
Have you ever tried trading with such strategy? You can always check your trading skills on Ayrex!

oficial-Ayrex- Posts : 253
Join date : 2017-01-13
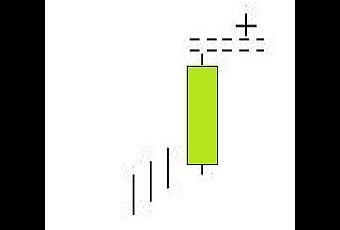
TRIPLE TRAINING WITH GAP AT THE LOOP I RECOMMEND AYREX BROKER OF BINARY OPTIONS THE BEST
![]() oficial-Ayrex Tue Mar 28, 2017 6:16 pm
oficial-Ayrex Tue Mar 28, 2017 6:16 pm
2. The second day can also be any color, as long as there is a gap between the body of the first day and yours.
3. The last two days are white. The bodies of these last two days must have holes in the direction of the body of the candle of the last day.

oficial-Ayrex- Posts : 253
Join date : 2017-01-13
BAJISTA TAP ALERT RECOMMEND BROKER OF BINARY OPTIONS AYREX THE BEST OF ALL
![]() oficial-Ayrex Tue Mar 28, 2017 6:18 pm
oficial-Ayrex Tue Mar 28, 2017 6:18 pm
2. On the first day a white candle appears.
3. The second and third day each have lower lows and higher lows than the previous day. Its color is not relevant.
4. The sizes of the bodies of the three days are of no importance.
oficial-Ayrex- Posts : 253
Join date : 2017-01-13
THREE BASS INTERIOR BOWLS AYREX BROKER OPTIONS BINARIA
![]() oficial-Ayrex Tue Mar 28, 2017 6:20 pm
oficial-Ayrex Tue Mar 28, 2017 6:20 pm
Definition
2. In the first two days a Harami Bassist pattern (or a Harami Cross) is observed.
3. Next, a black candle is seen on the third day with a lower closing than the second day.
oficial-Ayrex- Posts : 253
Join date : 2017-01-13
THREE CANDLES OUTSIDE BASS PLAYERS RECOMMEND AYREX binary options broker EXCELLENT BROKER
![]() oficial-Ayrex Tue Mar 28, 2017 6:22 pm
oficial-Ayrex Tue Mar 28, 2017 6:22 pm
2. On the first two days there is a pattern of Low Bandwidth.
3. On the third day there is a black candle with a lower closing than the second day.

oficial-Ayrex- Posts : 253
Join date : 2017-01-13
TWO BASS RAVENS, AYREX BROKER OF EXCELLENT BINARY OPTIONS
![]() oficial-Ayrex Tue Mar 28, 2017 6:25 pm
oficial-Ayrex Tue Mar 28, 2017 6:25 pm
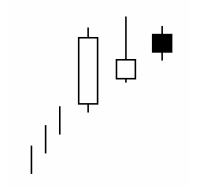
Definition
2. A strong white candle of normal or long size appears on the first day.
3. The second day is a black candle with an upward gap.
4. On the last day another black candle appears whose opening is inside the body of the second day and closes inside the body of the first day.

oficial-Ayrex- Posts : 253
Join date : 2017-01-13
BLOCKS AYREX LOW BUNDLING IS AN EXCELLENT 5 STAR BROKER
![]() oficial-Ayrex Tue Mar 28, 2017 6:28 pm
oficial-Ayrex Tue Mar 28, 2017 6:28 pm
2. The first day a white candle appears.
3. The next day is another white candle, which opens within the range of the previous day's body, and closes above the closing price of the previous day.
4. The last day is a short white candle, a spinning top or a Doji that forms a gap on the second day.

oficial-Ayrex- Posts : 253
Join date : 2017-01-13
Re: Trading BO with the indicators on your Android device
![]() oficial-Ayrex Tue Mar 28, 2017 6:30 pm
oficial-Ayrex Tue Mar 28, 2017 6:30 pm
2. On the first day a white candle appears.
3. The next two days are white candles where each closing is placed above the close of the previous day, and with openings within the range of the previous day's body.
4. The last two days have relatively longer upper shadows.

oficial-Ayrex- Posts : 253
Join date : 2017-01-13
THREE BLACK CIRTS AYREX IS THE BEST BROKER OF BINARY OPTIONS. I RECOMMEND IT
![]() oficial-Ayrex Tue Mar 28, 2017 6:32 pm
oficial-Ayrex Tue Mar 28, 2017 6:32 pm
2. There are three consecutive normal or long black candles.
3. Each candle opens inside the body of the candle of the previous day.
4. The candles are closed progressively with new lows below the previous day or at the same level as these.

oficial-Ayrex- Posts : 253
Join date : 2017-01-13
Re: Trading BO with the indicators on your Android device
![]() oficial-Ayrex Tue Mar 28, 2017 6:35 pm
oficial-Ayrex Tue Mar 28, 2017 6:35 pm
2. A white candle is observed the first day.
3. The second day is a white body that opens lower, quoted with a new maximum and then closes close to the minimum reached during the day.
4. The third day is a short black day above the second day.
oficial-Ayrex- Posts : 253
Join date : 2017-01-13
Re: Trading BO with the indicators on your Android device
![]() oficial-Ayrex Tue Mar 28, 2017 6:36 pm
oficial-Ayrex Tue Mar 28, 2017 6:36 pm
2. A normal or long white candle appears on the first day.
3. The second day is a short black candle that opens up a gap in the direction of the trend.
4. On the third day another black candle appears, which opens at the same opening price of the day before or above it, and then closes below the closing price of the previous day, but still above the close of the day. first day.


oficial-Ayrex- Posts : 253
Join date : 2017-01-13
THREE STARS BAJISTAS AYREX BROKER OF BINARY OPTIONS THE BEST
![]() oficial-Ayrex Tue Mar 28, 2017 6:37 pm
oficial-Ayrex Tue Mar 28, 2017 6:37 pm
2. There are three consecutive Doji.
oficial-Ayrex- Posts : 253
Join date : 2017-01-13
BABY ABANDONED BABY RECOMMEND AYREX THE BEST BROKER OF BINARY OPTIONS
![]() oficial-Ayrex Tue Mar 28, 2017 6:38 pm
oficial-Ayrex Tue Mar 28, 2017 6:38 pm
2. A white candle is observed on the first day.
3. On the second day we see a Doji, whose upper shadow forms a gap above the previous candle.
4. The black candle of the third day forms a gap in the opposite direction and without superimposed shadows.

oficial-Ayrex- Posts : 253
Join date : 2017-01-13
Re: Trading BO with the indicators on your Android device
![]() oficial-Ayrex Tue Mar 28, 2017 6:40 pm
oficial-Ayrex Tue Mar 28, 2017 6:40 pm
2. A white candle is seen on the first day.
3. Then, on the second day you see a Doji that makes gap in the direction of the uptrend.
4. A black candle is observed on the third day.
oficial-Ayrex- Posts : 253
Join date : 2017-01-13
BOW BLACK BASE RECOMMEND AYREX BROKER BINARY OPTIONS THE BEST
![]() oficial-Ayrex Tue Mar 28, 2017 6:41 pm
oficial-Ayrex Tue Mar 28, 2017 6:41 pm
2. On the first day a white body is observed.
3. The black body that forms on the second day opens lower than the close of the first day, and closes lower than the opening of the first day.
oficial-Ayrex- Posts : 253
Join date : 2017-01-13
BOWL PATCH RECOMMENDED AYREX BROKER OF BINARY OPTIONS
![]() oficial-Ayrex Tue Mar 28, 2017 6:42 pm
oficial-Ayrex Tue Mar 28, 2017 6:42 pm
2. On the first day there is a White Marubozu (or a white candle) 3. Then on the second day there is a Black Marubozu (or a black candle).
4. The second day begins with a downward gap, thus forming a gap between the body of the first day.
oficial-Ayrex- Posts : 253
Join date : 2017-01-13
HIGHEST COINCIDENTS BAJISTAS RECOMMEND AYREX BROKER OF BINARY OPTIONS
![]() oficial-Ayrex Tue Mar 28, 2017 6:43 pm
oficial-Ayrex Tue Mar 28, 2017 6:43 pm
2. On the first day a white body is observed.
3. The second day continues with another white candle whose closing price is exactly equal to the closing price of the first day.

oficial-Ayrex- Posts : 253
Join date : 2017-01-13
AYREX BROKER OF BINARY OPTIONS RECOMMEND AYREX BROKER
![]() oficial-Ayrex Tue Mar 28, 2017 6:44 pm
oficial-Ayrex Tue Mar 28, 2017 6:44 pm
2. On the first day a white body is observed.
3. On the second day, one sees again a white body that is covered in its entirety by the body of the first day.
oficial-Ayrex- Posts : 253
Join date : 2017-01-13
BAJIST FOUND LINES RECOMMEND AYREX BROKER OF BINARY OPTIONS
![]() oficial-Ayrex Tue Mar 28, 2017 6:46 pm
oficial-Ayrex Tue Mar 28, 2017 6:46 pm
2. The first day you see a black candle.
3. Next, on the second day a white candle is observed.
4. The closing prices are the same or almost the same on both days.

oficial-Ayrex- Posts : 253
Join date : 2017-01-13
STAR DOJI BAJISTA RECOMMEND AYREX BROKER OF BINARY OPTIONS.
![]() oficial-Ayrex Tue Mar 28, 2017 6:46 pm
oficial-Ayrex Tue Mar 28, 2017 6:46 pm
2. On the first day a white candle is observed.
3. Next, on the second day we see a Doji with a gap up.
oficial-Ayrex- Posts : 253
Join date : 2017-01-13
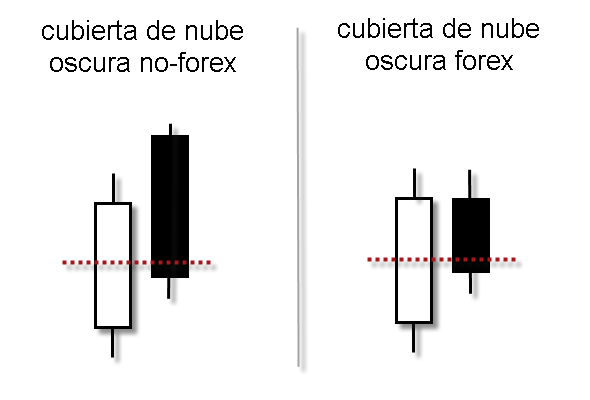
DARK CLOUD COVER BAJISTA RECOMMEND AYREX BROKER OF BINARY OPTIONS
![]() oficial-Ayrex Tue Mar 28, 2017 6:47 pm
oficial-Ayrex Tue Mar 28, 2017 6:47 pm
Definition
2. The first day a white candle appears.
3. A black candle opens on the second day with an upward gap and closes more than half inside the body of the first day.
4. The second day does not manage to close completely under the body of the first day.
oficial-Ayrex- Posts : 253
Join date : 2017-01-13
STAR BAUGHT FUGAZ RECOMMENDED AYREX EXCELLENT BROKER OF BINARY OPTIONS
![]() oficial-Ayrex Tue Mar 28, 2017 6:48 pm
oficial-Ayrex Tue Mar 28, 2017 6:48 pm
2. The first day of the pattern is a small white candle.
3. On the second day a small body is observed at the lower end of the quotation range. The color of this body is not relevant.
4. The upper shadow of this second candle should be at least twice as long as the body.
5. Has very little or no lower shadow.
oficial-Ayrex- Posts : 253
Join date : 2017-01-13
Page 1 of 4 • 1, 2, 3, 4 ![]()
» currency trading
» CFD Trading by IFC Markets
» Japanese sail patterns, strategy and more with ayrex binary options broker
» Proven Winner Fapturbo 2.0 with Live trading results